

Independent retail hit by a loss of -1,554 units in first six months of 2018.
Data released today by the British Independent Retailers Association (bira) and the Local Data Company (LDC) shows that independent retailers opened significantly more shops in H1 2018 than in the same period last year. However, a record number of stores were closed over the same period. This resulted in a total decline of -1,554 independent shops (-0.5%) - a significant decline from the increase of +762 shops (+0.27%) seen in H1 2017. The net loss of -695 units located on high streets alone was the main driver of this decline. Independent units categorised as ‘Service Retail' (including retailers such as barbers, hairdressers and dry cleaners) was the only category to see growth, with a net increase of +104 units in H1 2018.
Chain retailers (brands with more than 4 stores) have also remained in decline with a net loss of -2,848 shops (-1.36%) in H1 2018 across GB, which compares to -659 shops (-0.33%) in H1 2017.
Key information
Independents account for 65% of all retail and leisure units in Great Britain, the same as H1 2017.
In H1 2018 a total of 32,234 independents either opened (15,340) or closed (16,894), 14.8% up on H1 2017 where 28,076 opened (14,419) or closed (13,657).
The comparison goods retail category (non-perishable goods such as clothes, books and homewares) saw a net change of -1.63% in H1 2018 (-0.74% in H1 2017). This is a net decrease of -1,394 units, significantly higher than the -596 net change recorded in H1 2017.
Numbers of independent leisure units (including restaurants, cafes, bookmakers & entertainment) stayed the same in H1 2018 with no net change (0.00%) compared to a +0.55% increase in H1 2017. In H1 2018 there was a no change in the number of units (4,761 openings and 4,761 closures), versus a net increase in units of +475 net change in H1 2017.
The convenience retail category (bakers, butchers, food shops, & supermarkets) saw a net decline of -264 units (-0.86%) in H1 2018 versus a small increase of +24 units (+0.08%) in H1 2017.
Service retail (health & beauty, financial services, tattoo parlours and estate agents) was the only category of independents to see an increase in H1 2018 of +104 units (+0.10% versus +0.94% in H1 2017).
Key growth sectors have been barbers, beauty salons, tobacconists/e-cigarette shops, and Mobile phones. (see table 1 for more detail)
Sectors in decline include estate agents, newsagents, women’s clothing shops, and fashion shops. (see table 2 for more detail)
Vegan restaurants (+32%) and Vaping/Tobacconists (+6.7%) have increased the most as a percentage of their total units
The West Midlands showed the greatest increase of independents at +117 units (+0.49%) in H1 2018, versus +194 units (+0.93%) in H1 2017
Yorkshire & the Humber and Greater London saw the greatest decline of independents at -494 units (-1.64%) and -276 units (-0.40%) respectively
Portobello Road in London has the accolade of having the highest percentage of independents at 95% (based on locations with 50+ total units) overtaking Sparkhill in Birmingham (2nd) which was the top location in H1 2017
Ellenbrook is the town with the lowest percentage of independents at only 19%, against a GB average of 65% (based on locations with 50+ units)
Wider analysis of location types (analysis of location types by high streets, shopping centres and retail parks) shows that high streets saw a dramatic decline of -695 units in H1 2018. This represented a -0.41% net decrease in units.
Shopping centres saw a similar pattern in H1 2018 with a decline of -1.55% (versus +0.67% in H1 2017). Retail parks was the only location type to see growth in units of +1.48% (versus +3.41% in H1 2017) however this location type only accounts for 0.2% of all independents across GB.
Top 10 independent business openings by retail category

Table 1. Highest numbers of independent units opened by business type in H1 2018 across GB (Source: LDC)
Top 10 independent business closures by retail category

Table 2. Highest numbers of independent units closed by business type in H1 2018 across GB (Source: LDC)
National and regional net variations of independents

Table 3. Net percentage change (openings minus closures) of independent units by region in H1 2018 across GB (Source: LDC)
Top 10 independent towns (50+ units)
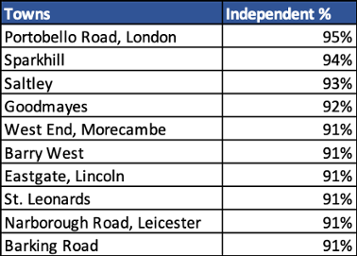
Table 4. Towns with the greatest percentage of independent retailers (Source: LDC)
Bottom 10 independent towns (+50 units)

Table 5. Towns with the lowest percentage of independent retailers (Source: LDC)
Change in numbers of independents by location type

Table 6. Net change by location type for Independents across 2,700 in and out of town GB locations (Source: LDC)
Further comment from Lucy Stainton:
Lucy Stainton, Senior Relationship Manager, Local Data Company commented:
“There is no doubt 2018 has already shown itself to be a particularly transformative year for the UK retail market. The shake-up across the physical landscape is impacting chains and independents alike. Businesses in all corners of the industry are having to look very closely at their current model and assess its relevance in an era of unprecedented consumer change. It is not all bad news for independent businesses though, if we look to the leisure sector, which has fallen into sharp decline for the first time in the first half of 2018, this has been driven entirely by a fall in chain outlets. Independents on the other hand have been able to take advantage of the consumer’s increased search for uniqueness.”
Andrew Goodacre, CEO, British Independent Retailers Association (bira), said
“This report perfectly illustrates the problems for independent retail businesses. Despite more businesses opening, we have seen more closing resulting in a net loss from the high street. bira have been saying for a long time that independent retailers need support from local and national governments. The recent budget announcements regarding a rates reduction and the setting up of a high street fund are very welcome and we hope it is not too late to provide a lifeline to these important businesses.”
Note: The total number of independent businesses covered in this research across GB was 310,080